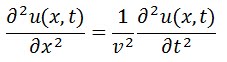
 The factor of the V is speed of the wave. Solution of this linear partial differential equation is;
 A: amplitude
k: constant
w: circular frequency
'phi'(greek letter): phase
Now if we fixed the boundary conditions there is no displacement at the end points;
u(0,t)=u(L,t)=0
Finally we have the standing wave that has nodes at the location of two endpoints. New solution for this specific problem is;
 Implementation this problem to matlab takes two steps, first create a function which calculates nodes, secondly create another function for plotting purpose;
function u=unodes(x,dt,n,w,phase)
u=cos(n*w*dt+phase).*sin(n*pi*x);
end
plotting function is;Finally we have the standing wave that has nodes at the location of two endpoints. New solution for this specific problem is;
 Implementation this problem to matlab takes two steps, first create a function which calculates nodes, secondly create another function for plotting purpose;
function u=unodes(x,dt,n,w,phase)
u=cos(n*w*dt+phase).*sin(n*pi*x);
end
function vs1d(xmin,xmax,n,w,phase)
%%%%%%%%%%%%%%%%%%%%
% Author: Mustafa DENIZ %
% Contact: mustafdeniz@itu.edu.tr %
%%%%%%%%%%%%%%%%%%%%%
tmax=2*pi/w; %maximum time
dt=0.05; %timestep
frms=round(tmax/dt); %number of frame
x=xmin:0.01:1; %grid x
for ii=1:frms-1;
plot(x,unodes(x,ii*dt,n,w,phase));
axis([xmin xmax -1.5 1.5])
m(ii)=getframe;
end
movie(m,3)
Subsequently we can change the nodes,phase length of string arbitrarily by typing this command, for example;
>>vs1d(0,1,1,1,2)
if we want see the third node just change value of n variable in command;
>>vs1d(0,1,3,1,2)
REFERENCES:
Hiç yorum yok:
Yorum Gönder